

In A short introduction to Dask for Pandas developers, we looked at how the fundamental components of Dask work. We examined the Dask dataframe and some other data structures that Dask uses internally.
Now we’ll zoom out and see how the higher-level components of Dask work, and how its client, scheduler, and workers share data and instructions. By understanding how tasks and data flow through a typical Dask program, you’ll be able to create your own more easily.
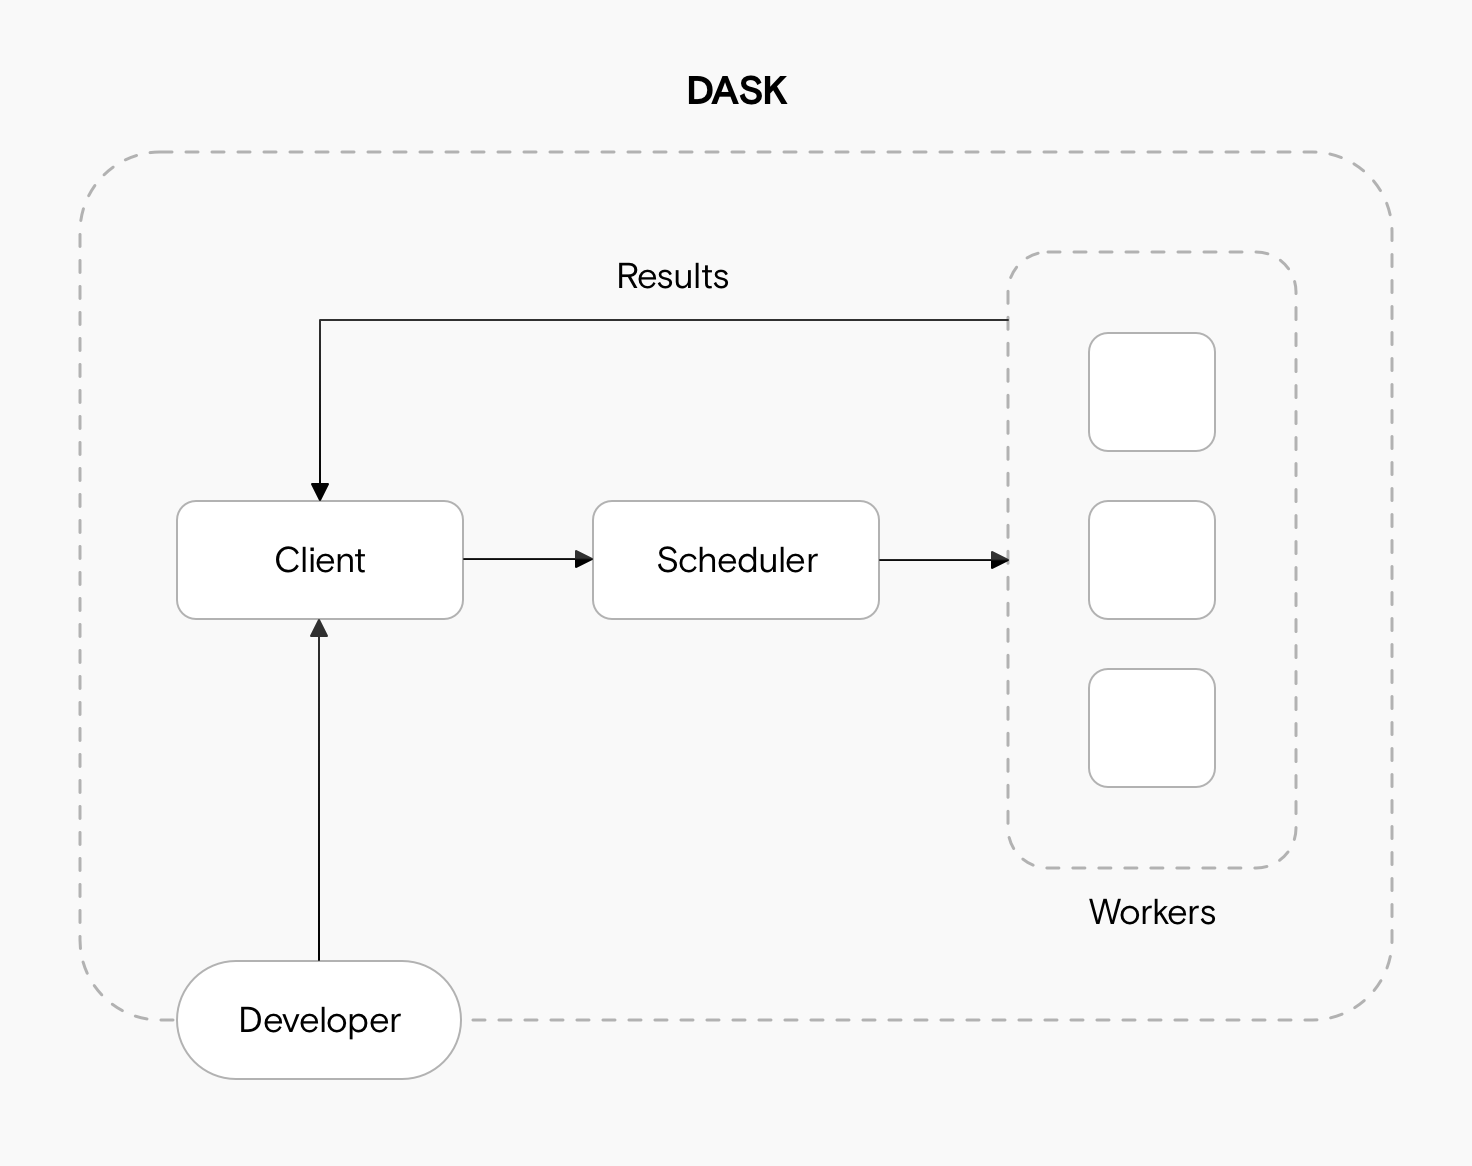
Dask consists of three main components: a client, a scheduler, and one or more workers.
- As a software engineer, you’ll communicate directly with the Dask Client. It sends instructions to the scheduler and collects results from the workers.
- The Scheduler is the midpoint between the workers and the client. It tracks metrics, and allows the workers to coordinate.
- The Workers are threads, processes, or separate machines in a cluster. They execute the computations from the computation graph.
The three components communicate using messages. These might be about metrics, computations, or actual data.
We’ll take a look at each of these components and then some example code. This will make it easier to follow how a typical Dask program works. Another helpful way is to read Dask’s Journey of a Task.
The Dask Client
The Dask client is what allows a developer to interact with Dask. There are several ways to create a Dask client, but the easiest is to run:
Even though we’re using the Client from the distributed module, this still works well on a singular machine and is the best way to interact with Dask locally.
The Client creates the Directed Acyclic Graph (DAG) of tasks by analysing the code, and is responsible for telling the scheduler what to compute. It gathers results from the workers and aggregates the results in the Client process.
The Dask Scheduler
The Scheduler acts as a middle layer between the client and the workers, instructing workers to execute the actual computations requested by the client. It also helps the workers coordinate with each other, deciding who should do which tasks.
The Scheduler is a single point of failure but it’s generally a very stable component of Dask. If a worker crashes or encounters an error, it’s easy for the scheduler to assign that work to a different worker, but this isn’t the case for the scheduler.
It is quite difficult to crash the scheduler. One way you can do this is by sending it a very large message that exceeds its available memory.
The Dask Workers
Workers, as the name implies, do the actual work. They execute the computations defined in the DAG. If necessary, workers can communicate to share data for a computation, but this can be very inefficient so you should avoid it.
Once they’re done with a computation, they return the results to the client, which aggregates them with results from other workers.
Sometimes it’s necessary for workers to share data with each other:
- When a worker is scheduled to be shut down. In this case, it transfers any intermediate results only present in its own memory to another worker.
- If the worker is taking significantly longer to complete a task than expected, while other workers are idle. In this case, other workers can “steal” work from the overloaded worker.
Because workers are executing tasks defined in a potentially different environment, it’s important to ensure the workers – among themselves and with the Client – have an exact match of Python versions and installed packages..
Messages in Dask
We’ve looked so far at how the components of Dask communicate with each other but without detailing what this communication looks like. In Dask, three kinds of messages can be passed between the components:
- Administrative messages: these are small pieces of information such as “Worker A has finished task X”. They’re serialised with msgpack, an optimized format similar to JSON.
- Data messages: these are usually substantially larger than the administrative messages, and often represent Numpy arrays or Pandas dataframes. Dask uses a combination of pickle files and custom serializers to pass on data.
- Task messages: these are computational tasks, i.e., the functions that need to be run on the data. These are also passed on using pickle or cloud pickle, which is an extension to Python’s standard pickle library customized for cluster computing.
Walking through an end-to-end example
Let’s look at a basic example: we’ll run a computation in Dask while keeping track of which component is doing what.
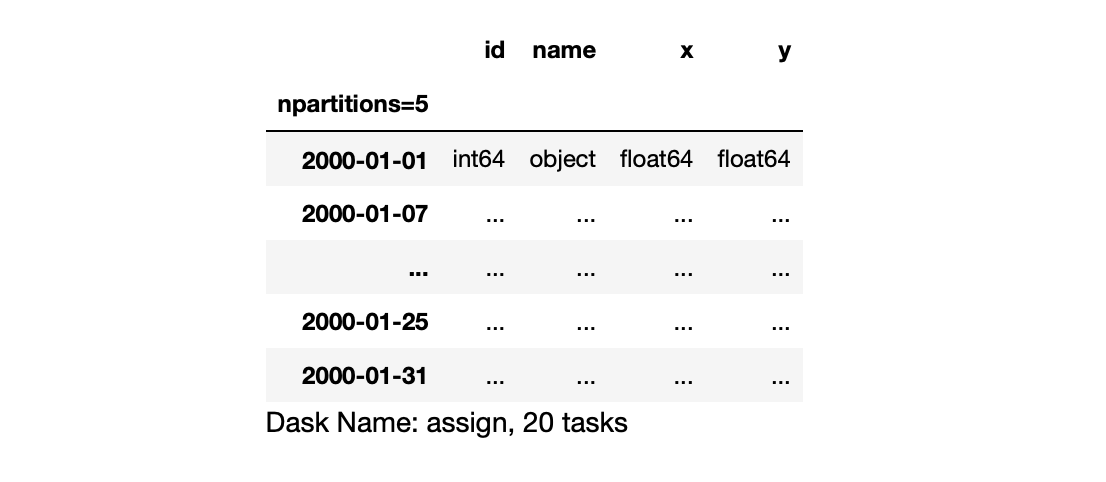
First we’ll set up an example Dask time series and add a basic computation (take all data to the power of 2). To follow along, you’ll need Jupyter Notebook with Dask installed. Run the following code in a cell.
As in the previous guide, this gives us a dataframe that knows how to compute the results we want, but hasn’t actually run this computation yet.
Now we’ll create a “cluster” to run computations on. In this example, our cluster will just be a process on our local machine, and the workers will be threads. But Dask abstracts this away, so if you scale up to a real cluster consisting of multiple machines, everything will work similarly. Run the following:
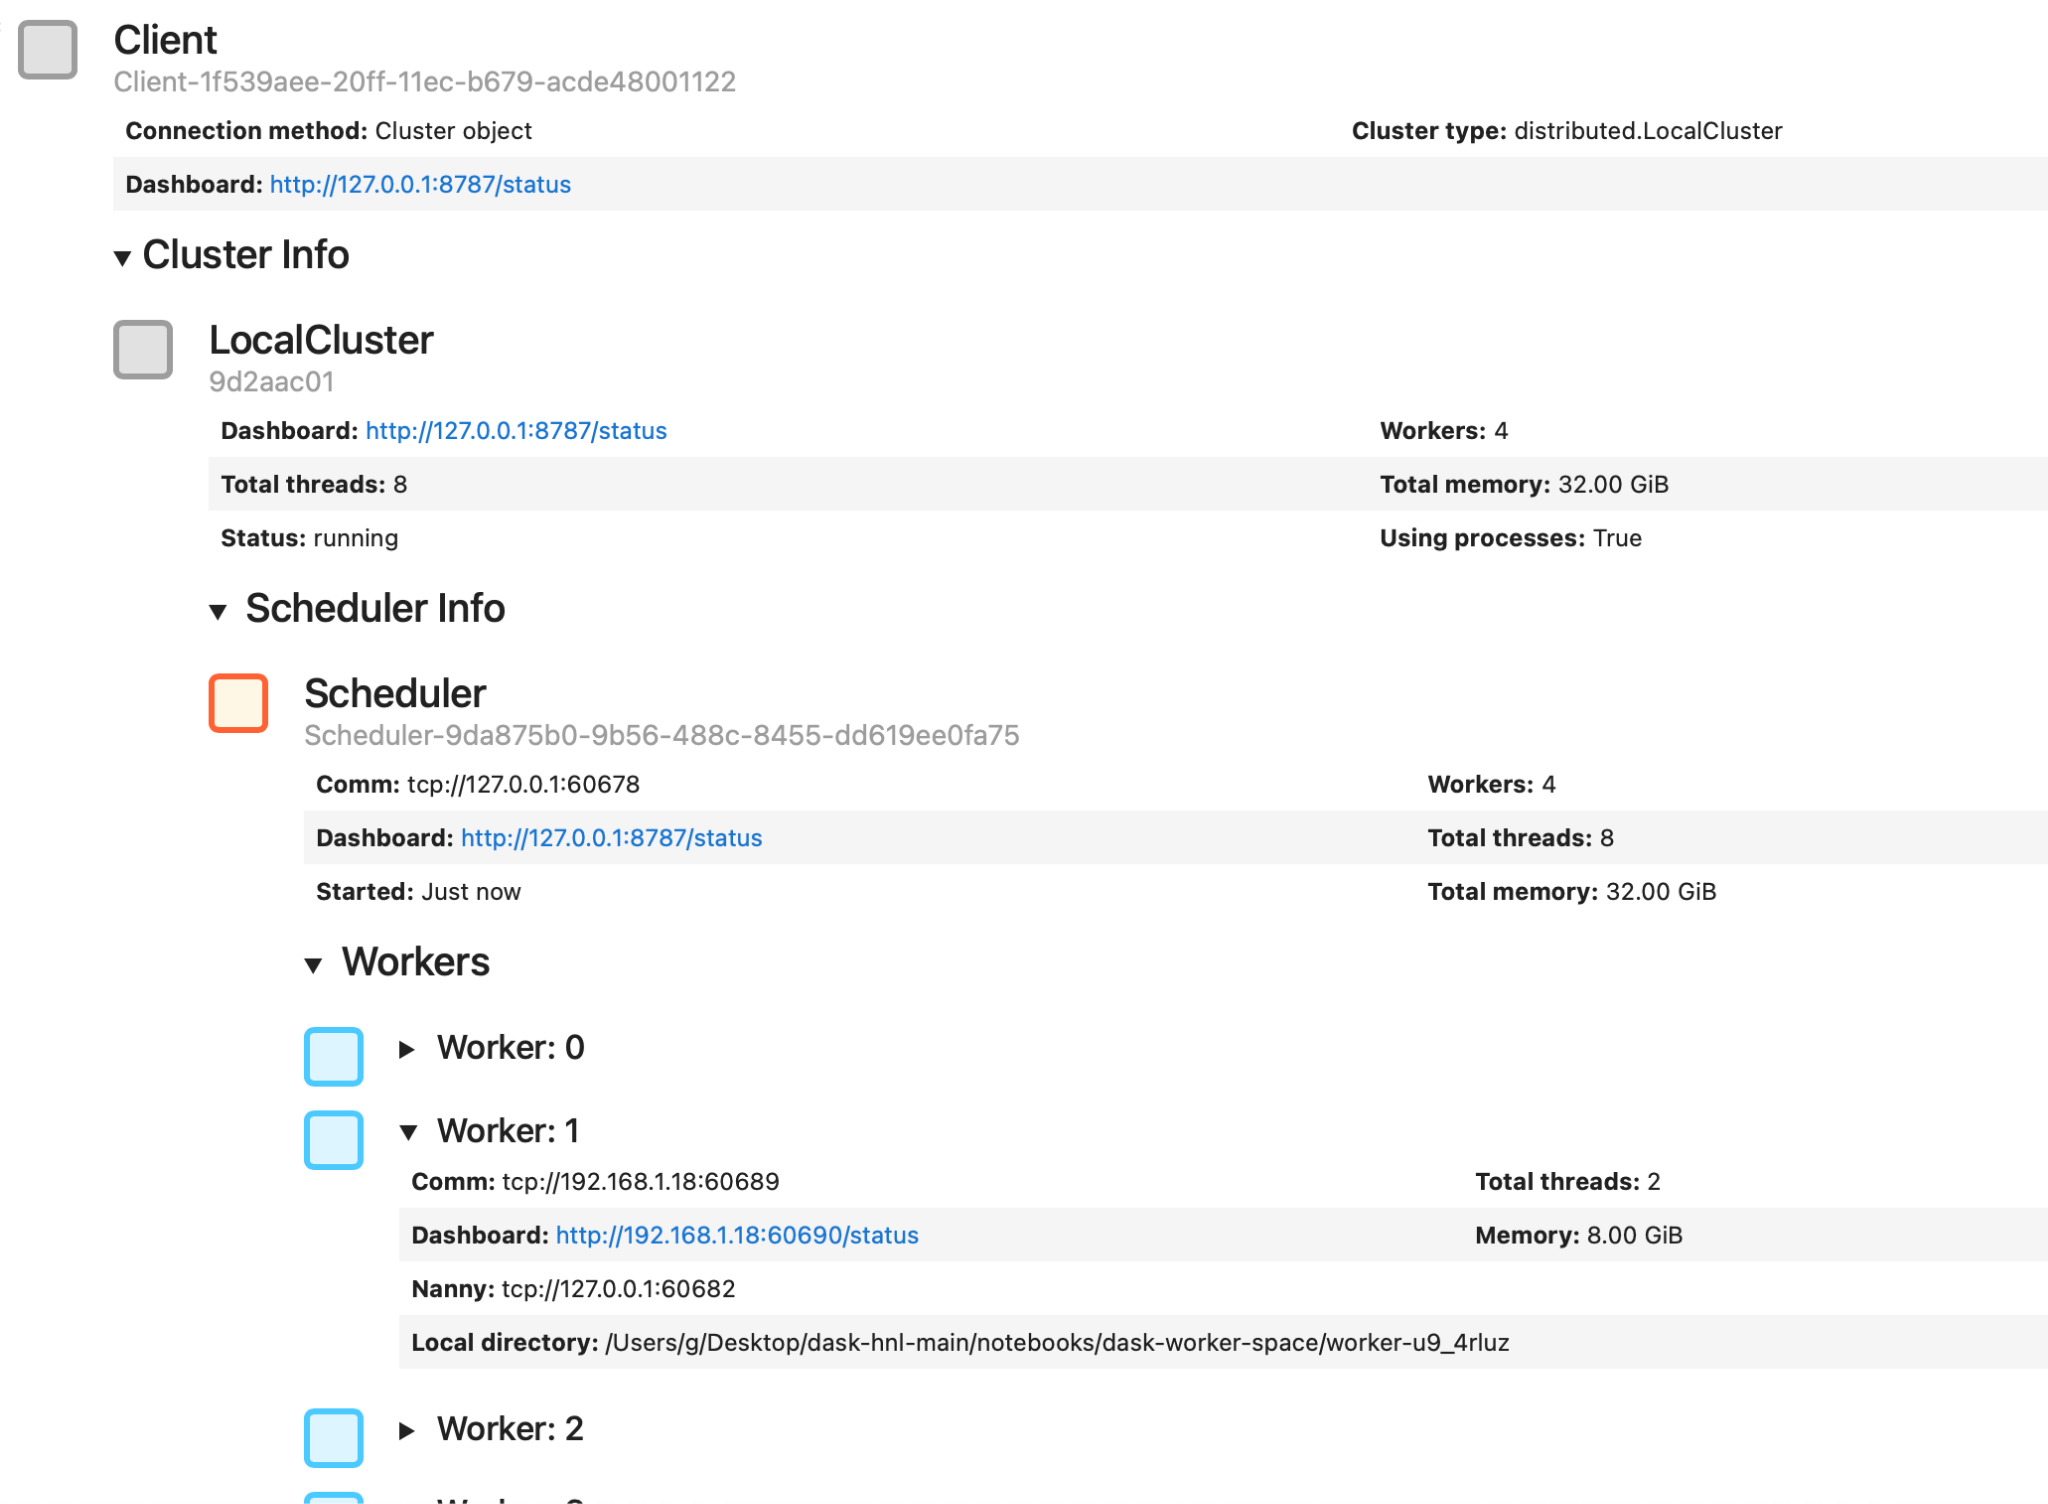
Dask will display information about your cluster and link to a dashboard where you can monitor it. You can expand the various sections to see more information on the Client, the Scheduler, and the Workers. In the example above, you can see how Dask has allocated the available resources (32 GB of RAM) between four workers (8 GB each).
We can create a Client to connect to our cluster as follows:
The client preview in Jupyter Notebook looks similar to the Cluster example above. Let’s now put our Cluster to work by getting it to execute the computation we defined before. Specifically, we’ll use Dask’s persist method, which instructs the workers to start the actual computation. Following Dask’s style of lazy computation, it’ll return to the Client immediately, confirming the work is submitted but before the results are available.
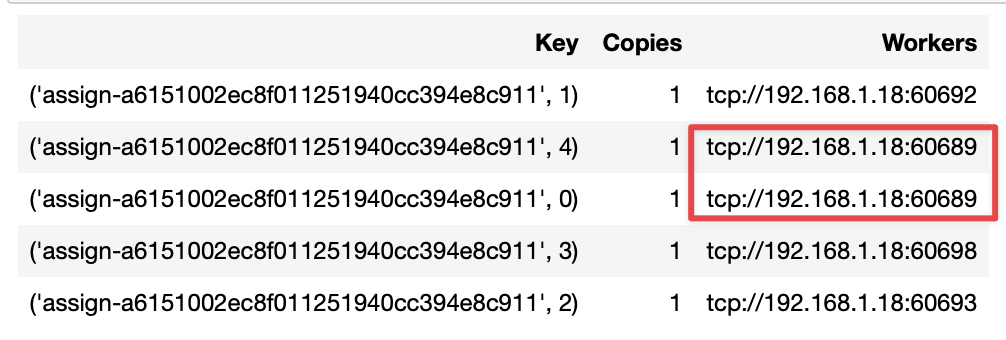
We can ask the Client which workers are working on what by running the following:
You should see something similar to the following image. Note that above, we see npartitions=5, but our cluster only contains four workers. When we inspect which workers were assigned which tasks, one worker appears twice.
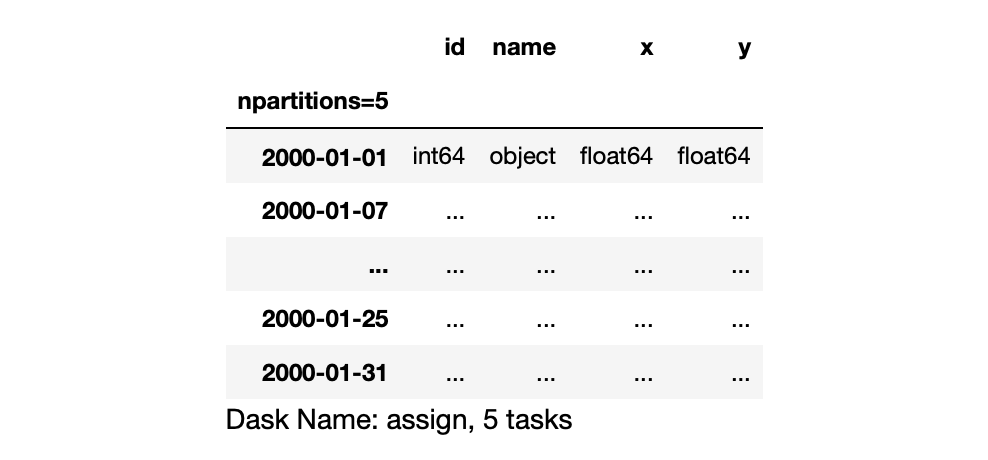
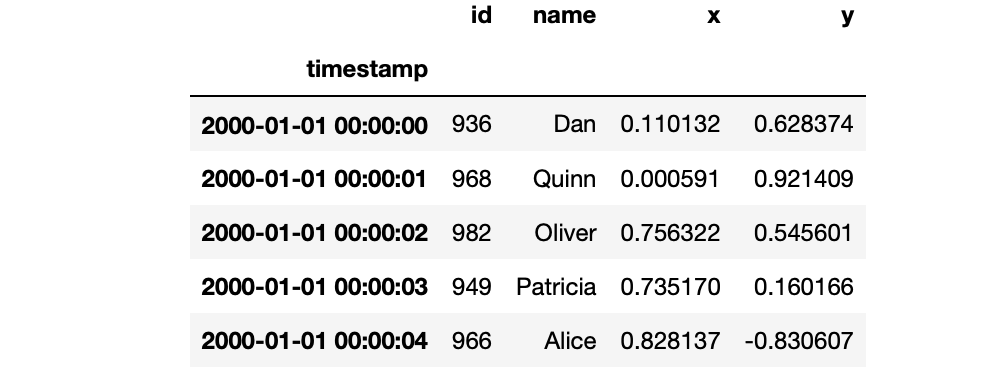
As mentioned, the computations were actually triggered and we can view the results in the Client if we wish. Run the following code to see the first five rows with the real data (or change the 5 to a bigger number to see more results):
Now you should see something like this:
Common pitfalls when working with Dask
While familiarizing yourself with Dask, you’ll likely make at least one common mistake.
Make a task graph that is too big
The size of the Dask graph depends on two things:
- The number of tasks;
- The size of each task.
Having either lots of smaller tasks or some overly large tasks can lead to the same outcome: the size in bytes of the serialized task graph becomes too big for the Scheduler to handle.
If you run into this problem, it’s more likely that some of your tasks are too large, especially if they depend on complex objects or large arguments. If you call a compute function and Dask seems to hang, or you can’t see anything happening on the cluster, it’s probably due to a long serialization time for your task Graph. Try to batch more computations together, or make your tasks smaller by relying on fewer arguments.
Make a graph with too many sinks or edges
Because Dask parallelizes your computation graph among many workers, you ideally want a graph that can be easily broken down into smaller sub-graphs. Your cluster can also be slowed to a crawl by relying too much on worker-to-worker computation. If you inspect the graph visually and see lots of edges between the partitions, then this is probably an issue.
A sink node collects data from many individual nodes. These are often bottlenecks in Dask as they have to wait for the individual computations of every node they depend on. Defining your tasks such that Dask can easily create an efficient computation graph is something you’ll learn with practice.
Have workers with incompatible packages
Having even a slightly different version of your dependencies on the workers can lead to unexpected and hard-to-debug results. Luckily, a simple check is built into Dask:
This will give you a big JSON dump of the packages along with their versions on each Dask component and it will warn you of any differences or incompatibilities.
Using Dask on Open MLOps
If you want an easy way to set up a Dask cluster on Kubernetes, take a look at our Open MLOps framework, which combines Dask with several other production-focused machine learning tools. It’s under active development, so feel free to open a GitHub issue if you run into issues. Our team will be happy to help.